vnstat sur Raspberry Pi pour surveiller le trafic réseau
Nous allons voir ici comment installer vnstat pour surveiller le trafic réseau et afficher une petite page de synthèse sur l'utilisation du trafic. Cela peut-être utile par exemple pour mesurer le trafic traversant une passerelle Raspberry Pi construite tel que raconté ici.
vnstat en ligne de commande
Tout commence avec (e.g. sous Raspbian Jessie) :
apt install vnstat vnstati
Demandons alors à vnstat de créer une base de données du trafic pour l'interface que l'on veut surveiller :
vnstat -i eth0 -u
Désormais, un appel à la commande vnstat affiche en ligne de commande une synthèse sur le trafic réseau :
vnstat -u #Mise à jour des informations
vnstat #Affichage de la synthèse
Database updated: Sat Jun  4 13:02:00 2016

   eth0 since 29/05/16

          rx:  136.26 MiB      tx:  411.92 MiB      total:  548.18 MiB

   monthly
                     rx      |     tx      |    total    |   avg. rate
     ------------------------+-------------+-------------+---------------
       May '16    134.72 MiB |  410.23 MiB |  544.94 MiB |    1.67 kbit/s
       Jun '16      1.55 MiB |    1.69 MiB |    3.24 MiB |    0.09 kbit/s
     ------------------------+-------------+-------------+---------------
     estimated         8 MiB |       8 MiB |      16 MiB |

   daily
                     rx      |     tx      |    total    |   avg. rate
     ------------------------+-------------+-------------+---------------
      29/05/16    134.72 MiB |  410.23 MiB |  544.94 MiB |   51.67 kbit/s
         today      1.55 MiB |    1.69 MiB |    3.24 MiB |    0.57 kbit/s
     ------------------------+-------------+-------------+---------------
     estimated         1 MiB |       1 MiB |       2 MiB |
vnstat sur une page web
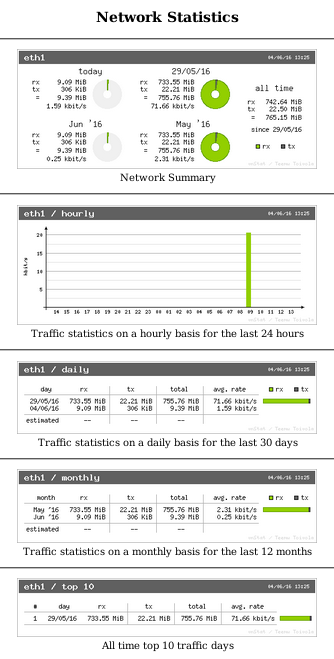
vnstati est une commande parente de vnstat qui génère une image de synthèse plutôt qu'un tableau. Pratique pour nous, êtres humains, qui aimons la bigarrure ! Alors demandons à vnstati de nous géréner quelques images à l'aide de ce script que l'on pourra placer dans cron :
#!/bin/bash
vnstat -u -i eth0
vnstati -s -i eth0 -o /var/www/html/summary.png
vnstati -h -i eth0 -o /var/www/html/hourly.png
vnstati -d -i eth0 -o /var/www/html/daily.png
vnstati -t -i eth0 -o /var/www/html/top10.png
vnstati -m -i eth0 -o /var/www/html/monthly.png
Et pour afficher ces images, nous allons utiliser une petite page web et nginx :
apt install nginx
puis remplaçons la page par défaut /var/www/html/index.nginx-debian.html par index.html contenant :
<!doctype html>
<html>
<head>
<meta charset="utf-8">
<title>Statistics</title>
</head>

<body>
<h2 align="center">Network Statistics</h2>
<hr align="center">
<p align="center"><img src="summary.png" alt="Summary"/><br/>
  Summary
</p>
<hr align="center">
<p align="center"><img src="hourly.png" alt="Traffic stats on a hourly basis for the last 24 hours "/><br/>
  Traffic stats on a hourly basis for the last 24 hours
</p>
<hr align="center">
<p align="center"><img src="daily.png" alt="Traffic stats on a daily basis for the last 30 days"/><br/>
  Traffic stats on a daily basis for the last 30 days
</p>
<hr align="center">
<p align="center"><img src="monthly.png" alt="Traffic stats on a monthly basis for the last 12 months"/><br/>
  Traffic stats on a monthly basis for the last 12 months
</p>
<hr align="center">
<p align="center"></p>
<p align="center"><img src="top10.png" alt="All time top 10 traffic days"/><br/>
  All time top 10 traffic days</p>
<hr align="center">
</body>
</html>
et si l'on pointe un navigateur vers l'adresse IP du Raspberry Pi, on voit alors s'afficher :


